How to monitor the GPU utilization
-
Open the terminal and type:
nvtop -
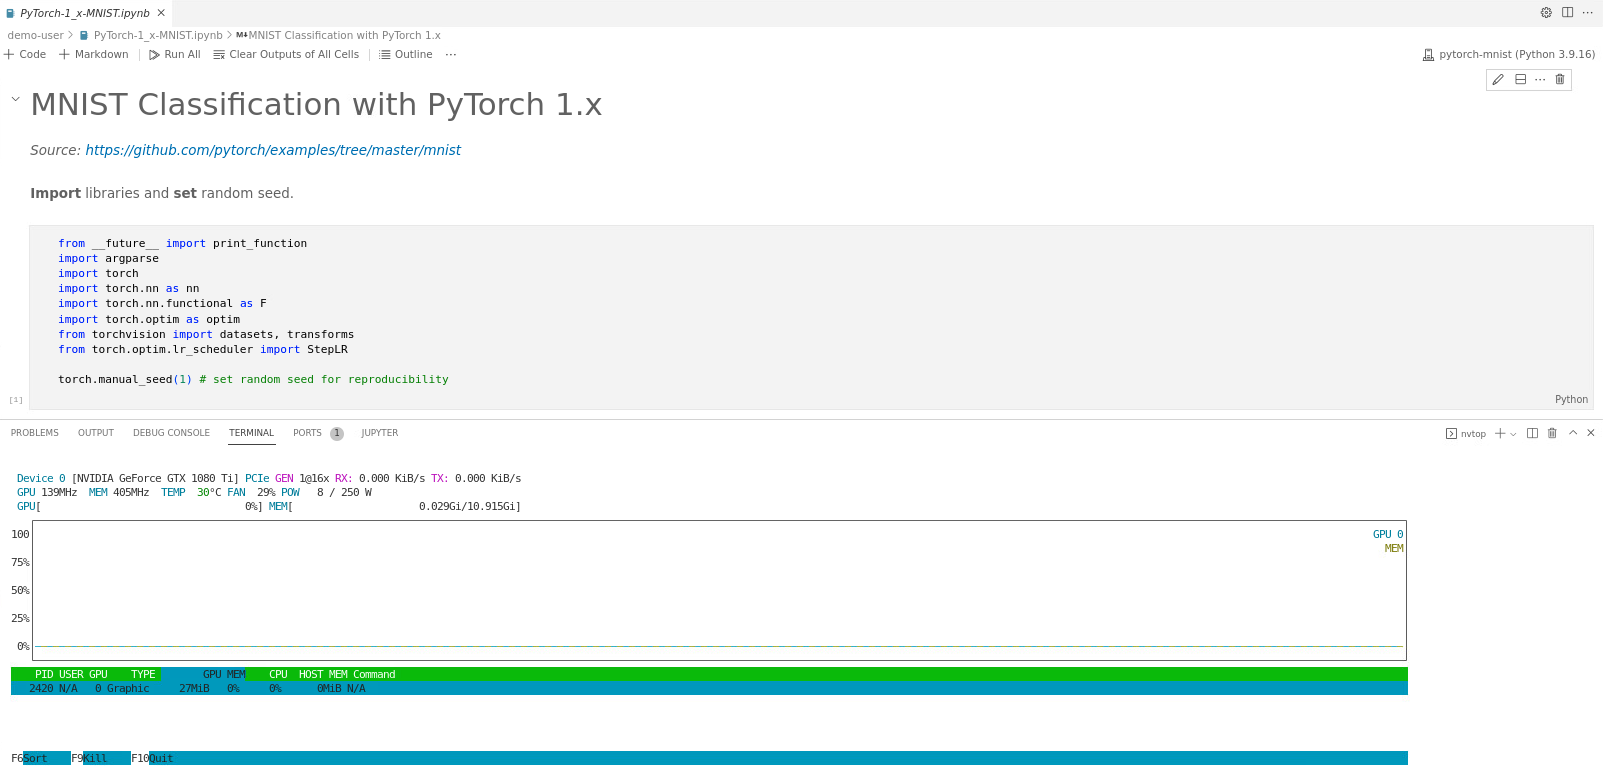
Your screen should look like Fig. 1.

Fig. 1.
-
If you want to test the same example as given in Fig. 1, refer to the
First-Time-Usagesection for further details. -
Run your code… While running,
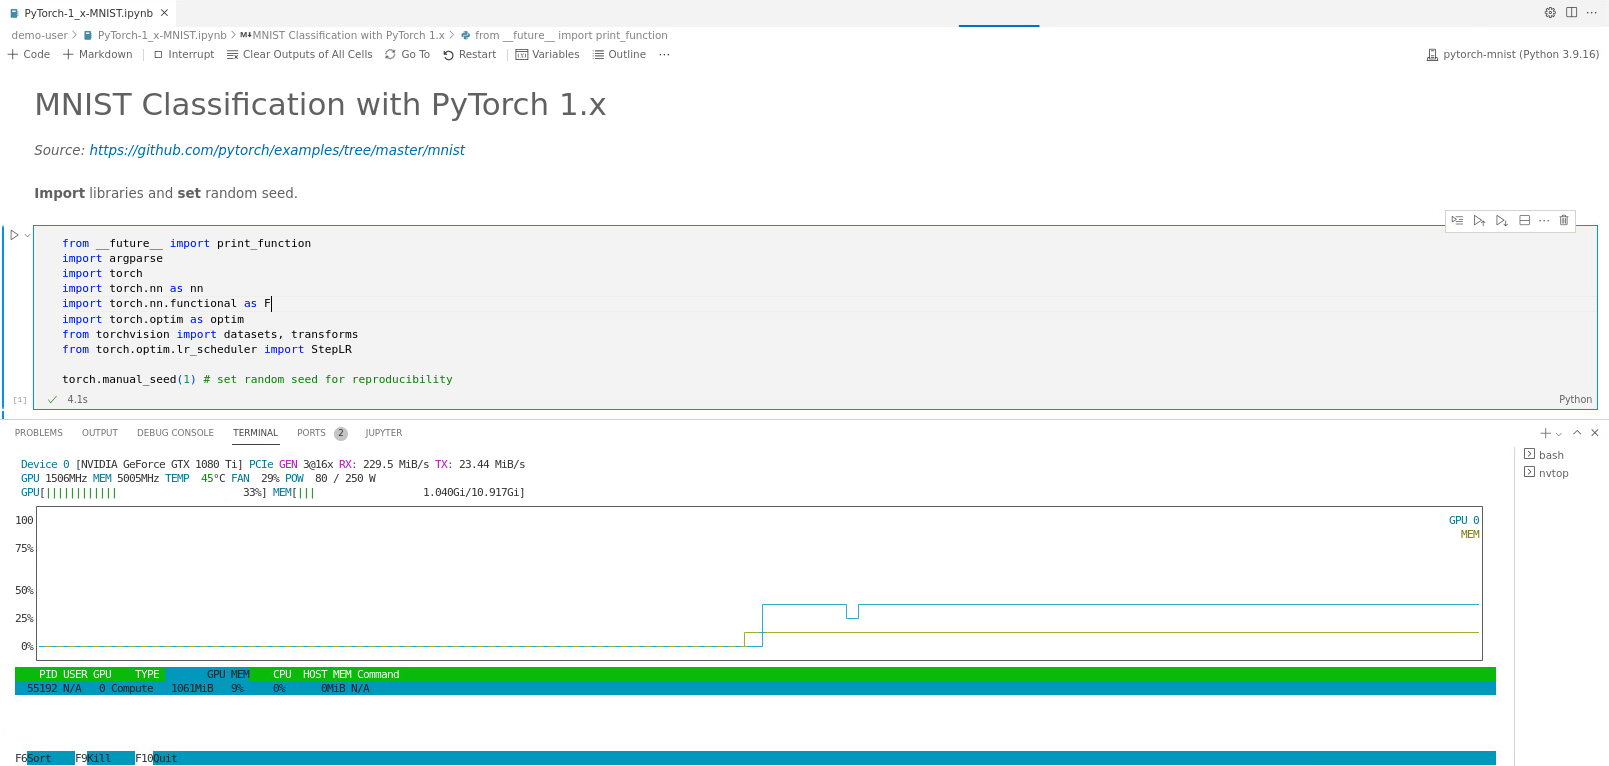
nvtoplooks like Fig. 2.
Fig. 2.
-
To close
nvtop, pressF10. - As shown in Fig. 2,
nvtopallows you to monitor in real time how much GPU processing power,GPU (%), and memory,MEM (GB), your code is using. In this example we are condering the GPUGeForce GTX 1080 Ti. To check all available GPUs in Styx and its specs refer to available GPUs and node types.GPU (%)
- While running this example, the GPU utilization is 33%, see Fig. 2. That is, we are not using the full potential of the GPU. We can increase this percentage by optimizing the code.
MEM (GB)
- While running this example, the memory utilization is ~9.5%, or ~1GB/11GB, see Fig. 2. In principle, training large models require more memory. If you exceed the memory, your code will stop. You can also check the log file of your job to understand why your code have stopped.